
Author’s note. I wrote this post in 2017 after the Warriors won their 3rd title in 4 years. The use of analytics and GCP BigQuery has only increased since then. It’s interesting to look back at what they were able to achieve being data-driven, and how far they’ve come.
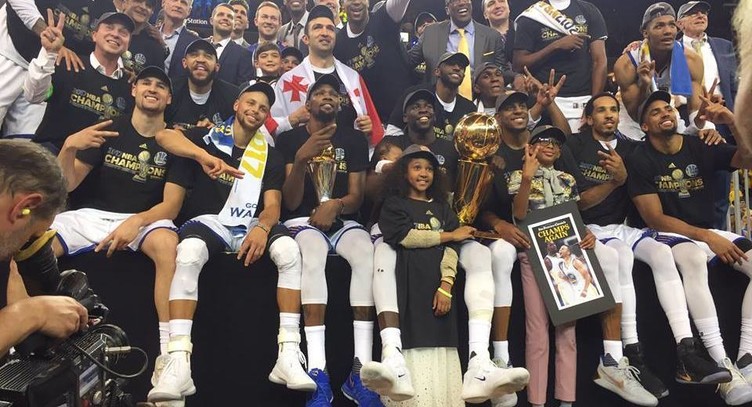
The Warriors triumphed in record breaking fashion in the NBA playoffs, going an amazing 16-1. LeBron James to his credit, averaged a triple double in the finals, but it wasn’t enough.
Of course many said this win was ordained July 4th, 2016 when the eventual MVP of the finals Kevin Durant, made the decision to join the Warriors. But something else might have been in play.
Pundits pointed to Game 3 of the finals where the Warriors stormed back to shock the Cavaliers, effectively ending any hope of a come back. In that game, many commentators expressed how LeBron (and Kyrie Irving) looked “gassed”. Many blamed how tired they were after a long season.
In fact, the data shows that LeBron played the most minutes of any player in the league during the regular season. The table below shows he was ranked first, and Kyrie 15th. The first Warrior doesn’t appear until Klay Thompson at 28th, and Curry & Durant rank 38th!

Two years ago along with many I watched and marveled as the Golden State Warriors took on and defeated all challengers in the regular season. Then in the playoffs, each time they faced adversity, coach Steve Kerr seemed to have all of the answers.
One of the major turning points came with finals MVP Andre Iguodala‘s insertion into the starting line-up in game four. Making it much harder for LeBron James to continue his dominance. But how did Andre, a 31 year old veteran, play so hard after such a long season? The fact that he did not start a single game in the regular season kept him fresh. The Warrior’s deep bench and dominance during the regular season even allowed Kerr to rest league MVP Steph Curry in 20 fourth quarters, when the Warriors were way ahead.
Unsurprisingly, being a Bay Area/Silicon Valley team, owned by a venture capitalist who undoubtedly knows a thing or two about tech, analytics and data, it goes much deeper than just gut feel when resting players. As this article by ESPN, “Biggest winner of the Finals? Rest!“, pointed out the data that may have been the most valuable was not about shot percentage, match-ups or even opponent tendencies, but about the amount of effort, rest and potential fatigue of each player on the team. When the Warriors fans donned jerseys back in 2015 that said “Strength in Numbers” there was a double entendre.

As clients of wearable technology provider Catapult Sports, they monitor their players’ workloads in practice with GPS monitors and analyze the data with acute attention to maximizing performance while minimizing injury risk.
The project back in 2015: Led by the training staff, Gelfand and the team’s data programmers, the Warriors had engineered a readiness rating for each player built on a 0-to-100 scale (100 is prime shape and 0 is burnt out).
The idea was to give Kerr a handy all-in-one metric that aggregates various health indicators, including a daily five-question survey given to the players to help assess their soreness. Simple questions like, “How do you feel?” and “What’s your mood?” and “How’d you sleep?” Each question has multiple phrases that the players choose from. Each answer corresponds to a number on a five-point scale. The lower the number, the lower the stress levels.
“It’s research,” Lyles says of the survey. “The wording in the answers are specific so it gives guys a good guide. Each guy is very individual. I may ask you the same questions. We want a low score. The best score you can have is a five. So let’s say your average is an 11, that’s your norm after months of doing it. It’s 5 to 25. One point for each question.
“You come in, now you have two days that are 18 and 19. All right, now that’s a trigger. He’s normally an 11, let’s check in. If it’s sleep, we’ll look at the questions that are bad. We’ll look at the travel.”
The Warriors noticed that player stress was linked to lack of sleep. So they rescheduled their flights to the day after, not the night of games, so they could sleep in and get a full night’s rest.
With the subjective side taken care of, the team then tackles the objective portion. They look at SportVU player-tracking data (for game workloads), Catapult data (for practice workloads) and Omegawave heart variability data (to test neurological stress). With these four inputs (including the subjective side), the Warriors have a dashboard that indicates whether a player should give it a go, and for how long.
What the Warriors did in 2015 and every year since is what every business should be looking to do with their own data. Most companies focus on the “objective portion” relying on specific facts that have occurred through historical transactions from their systems, or purchased from outside sources. All of this data goes into high performance and visualization analytics that ultimately come up with what they believe to be the right answers or insights to form the basis of strategic decisions for the company.
What’s often missing is the subjective data that can be equally if not more valuable. In the Warrior’s case it was individualized feedback from their players. In business this could be input from sales teams, “the feet on the street” who are interacting with customers, and encountering the latest, most accurate data, and typically have no way of feeding that back into the mix. This is a lost opportunity, as sales people in large corporations could be their biggest data-driven advantage.
The Warriors have shown is that a fully closed-loop of objective data, complemented by subjective feedback, delivers the most reliable data. Only then can coach Kerr have confidence in the recommended actions derived from relevant insights for each player.
Surprisingly even some of the largest corporations don’t embrace this concept. Billions are being poured into analytics, but they are still siloed from any frontline business applications that are used for day-to-day execution. As the most popular consumer data-driven applications such as LinkedIn and Facebook have shown, the most immersive and complete experience comes from a new generation of apps that are both analytical and operational. Only then can you gather data from those closest to the action, while blending the information with complementary sources to get the complete picture.
The Warriors tipped the scales in their favor through their version of a data-driven application back in 2015. Clearly in 2017, they continued their data-driven ways. Emphasizing once again that “Strength in Numbers” is as much about the data (and in this case managing minutes and rest), as it is about fan support, and bench strength.
From hoops to Hadoop, congratulations to the Warriors, now it’s time for not just the rest of the NBA, but corporate America to catch up. Your own enterprise data has insights which can help drive your business. Before you rush to leverage it, make sure it’s reliable and relevant.